Automatic Analysis of Voting Procedures
This work was done in the context of my honours Bachelor’s thesis in Artificial Intelligence at the University of Amsterdam. My supervisor was Ulle Endriss, and the thesis was completed in Augst 2008. Download the complete thesis.

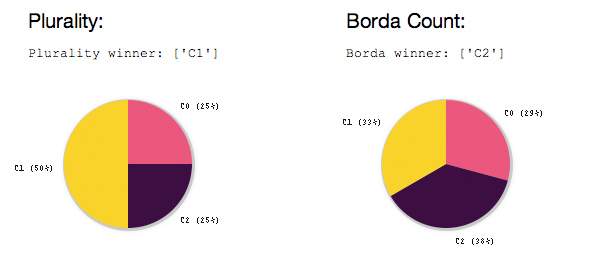
An example election where plurality and Borda count elect different candidates. Here one voter votes C0>C2>C1, one votes C2>C0>C1 and two vote C1>C2>C0.
There are many different ways to elect a winner from a group of candidates. The best known method is the plurality rule, for which each voter selects one candidate to vote for and the candidate receiving the most votes wins. Some methods require the voters to rank the candidates, after which points are assigned. An example of a positional scoring rule like this is the Borda count. There are many other voting procedures in use as well, such as approval voting, where voters can select an acceptable set of candidates, or the single transferrable vote, where votes for the most unpopular candidates are redistributed until one candidate has an absolute majority. Other less well known voting procedures considered here are Copeland and Dodgson’s procedures.
Each voting procedure may satisfy its own set of criteria, such as always electing the candidate who is first-ranked by an absolute majority of the votes if this candidate exists (majority criterion), or always electing the candidate who would win in a pairwise comparison to all other candidates (Condorcet criterion). Each voting procedure also may make it more or less difficult for a voter to manipulate the outcome of the election by not voting according to his true preferences. Furthermore, for some voting rules it can be very difficult to find the winner, for some rules finding the winner is even NP-hard.
For my thesis I compared a selection of voting procedures in two ways. Firstly we found the smallest election instances in which the different procedures would elect different candidates. Secondly we generated many elections with random sets of voters to check how often different procedures coincide; how often different procedures elect the Condorcet winner (i.e. the candidate who would win in a pairwise comparison with all other candidates), and how often different procedures elect the Condorcet loser (i.e. the candidate who would lose in a pairwise comparison with all other candidates).
To be able to do all of this comparison I made a python library of voting methods which you can peruse here. That repository includes some of the visualisations I used which I wrote for the canvas environment in HTML 5, but it’s all a little poorly documented so please contact me if you want to use it and are having trouble.
